
Full Stack & System Design
Replaced timing-out REST endpoints with a GraphQL
Stack
React.js
Node.js
Redis
PostgreSQL
GraphQL
Docker
Kubernetes
Typescript
Redux
Storybook
Apollo Server
About
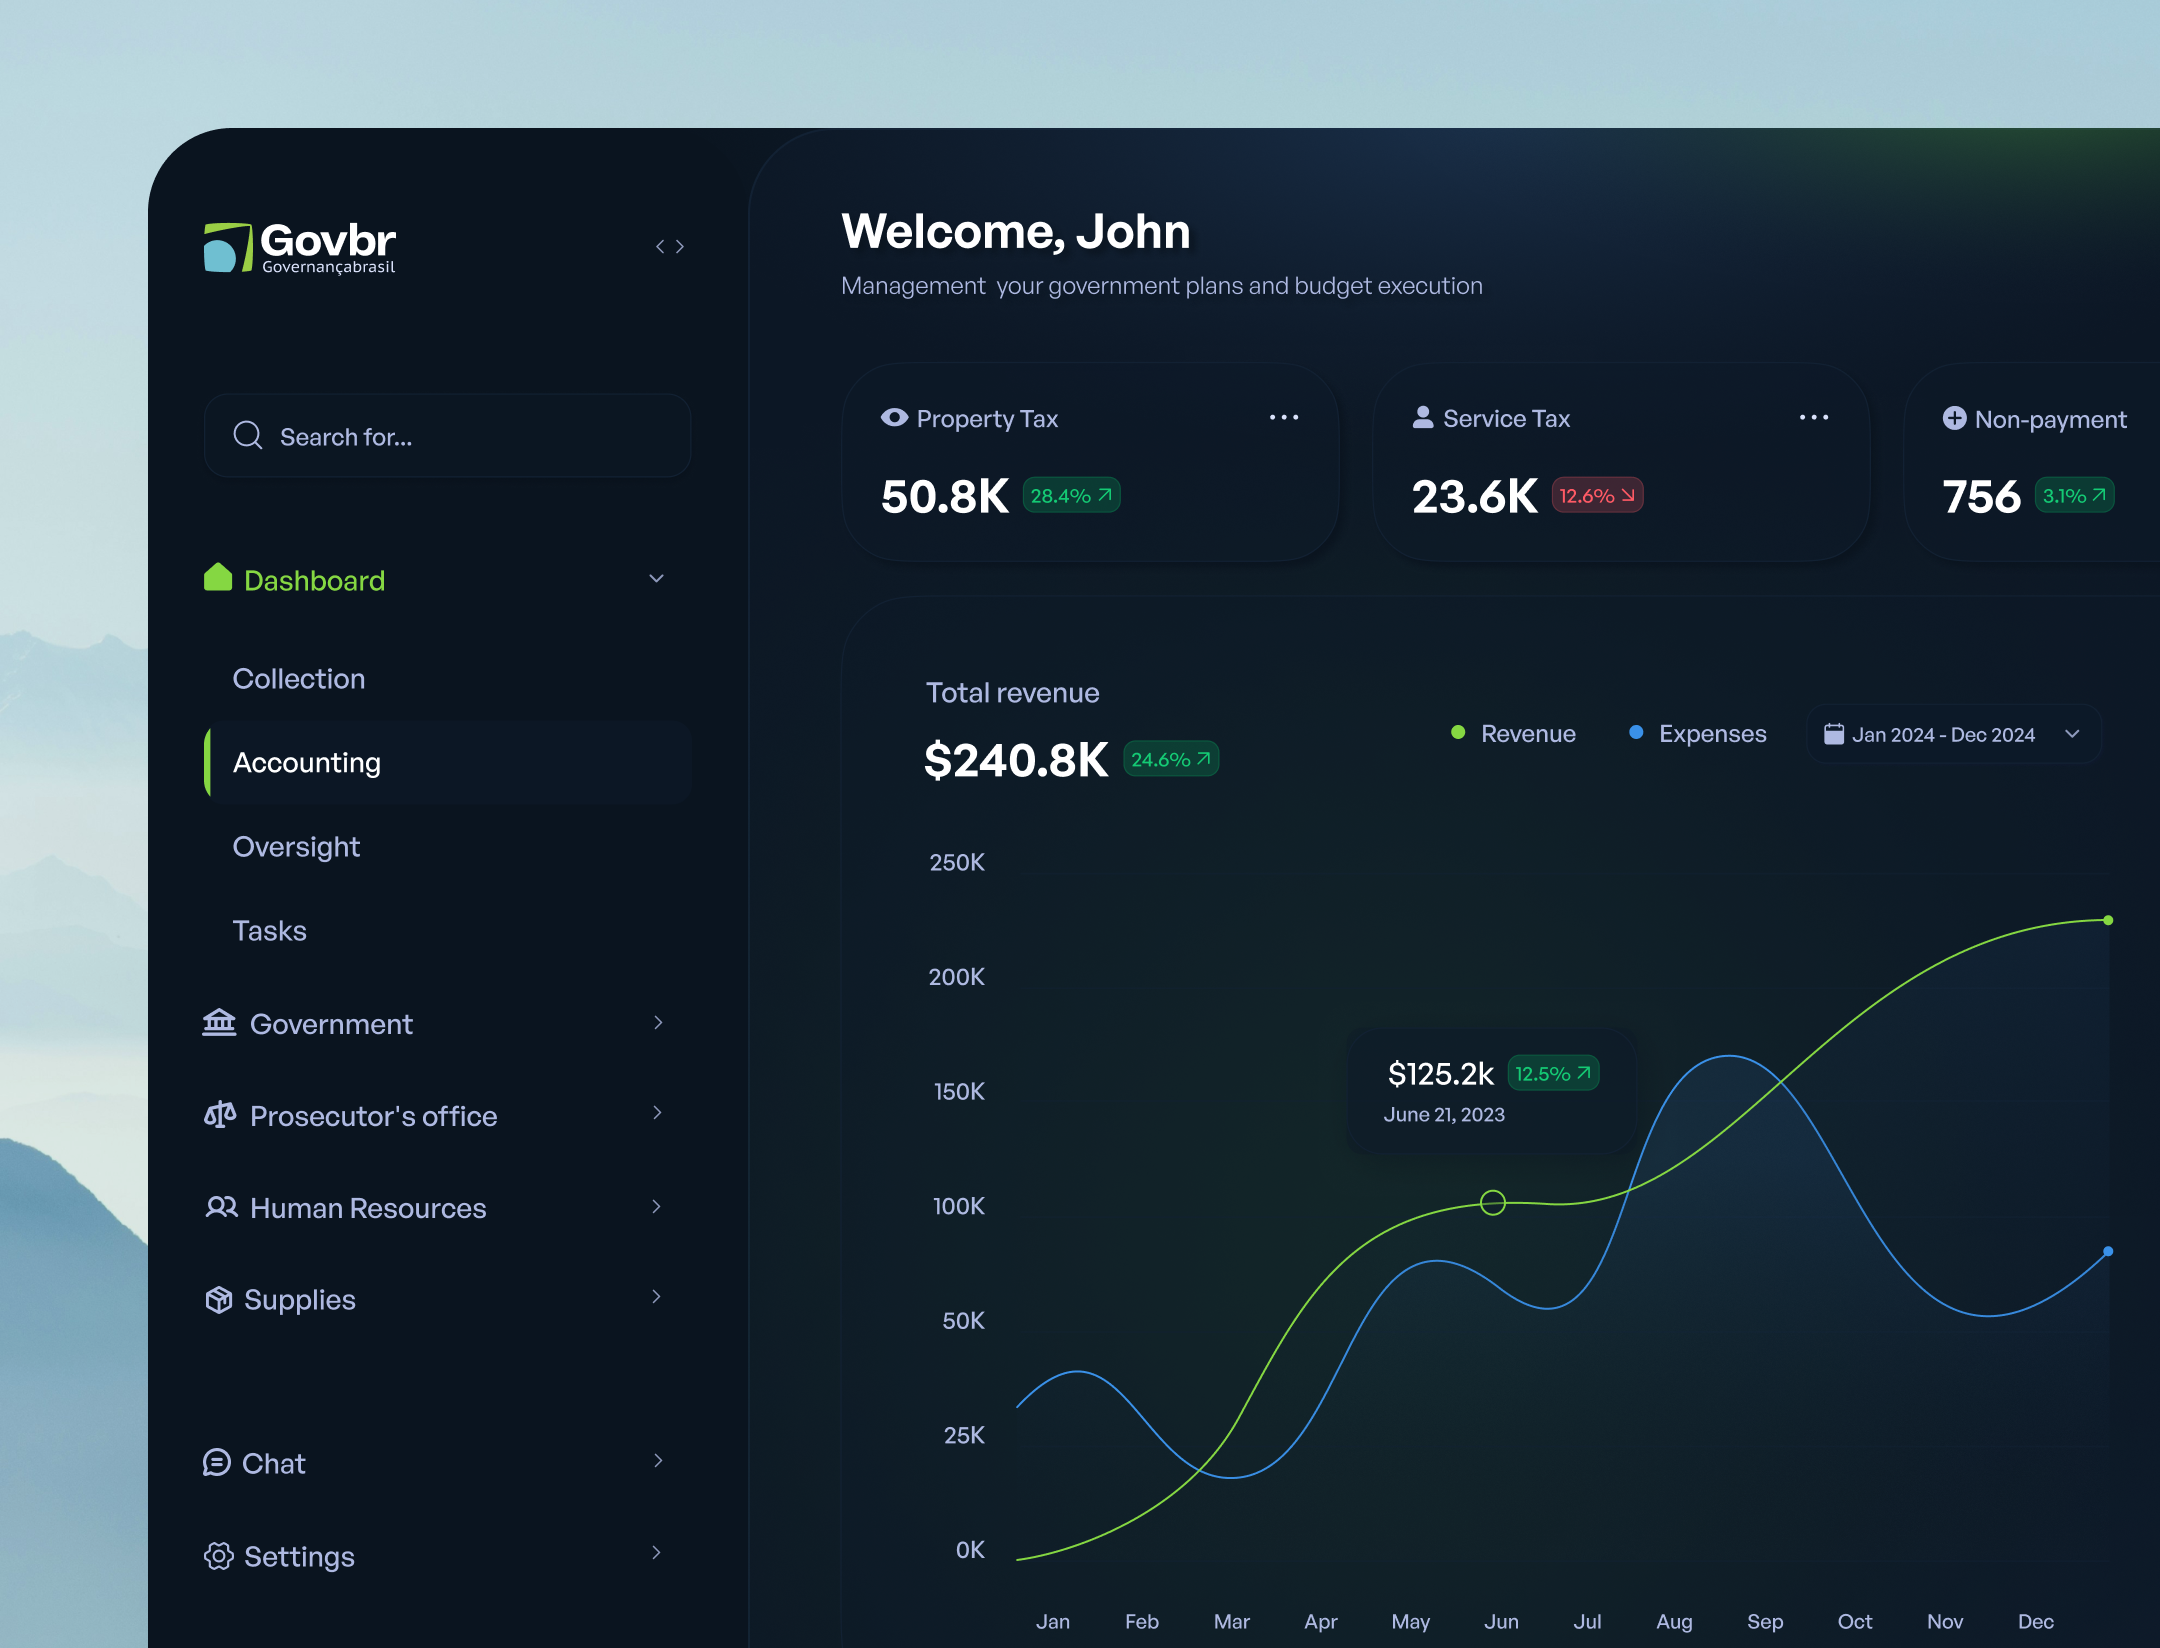
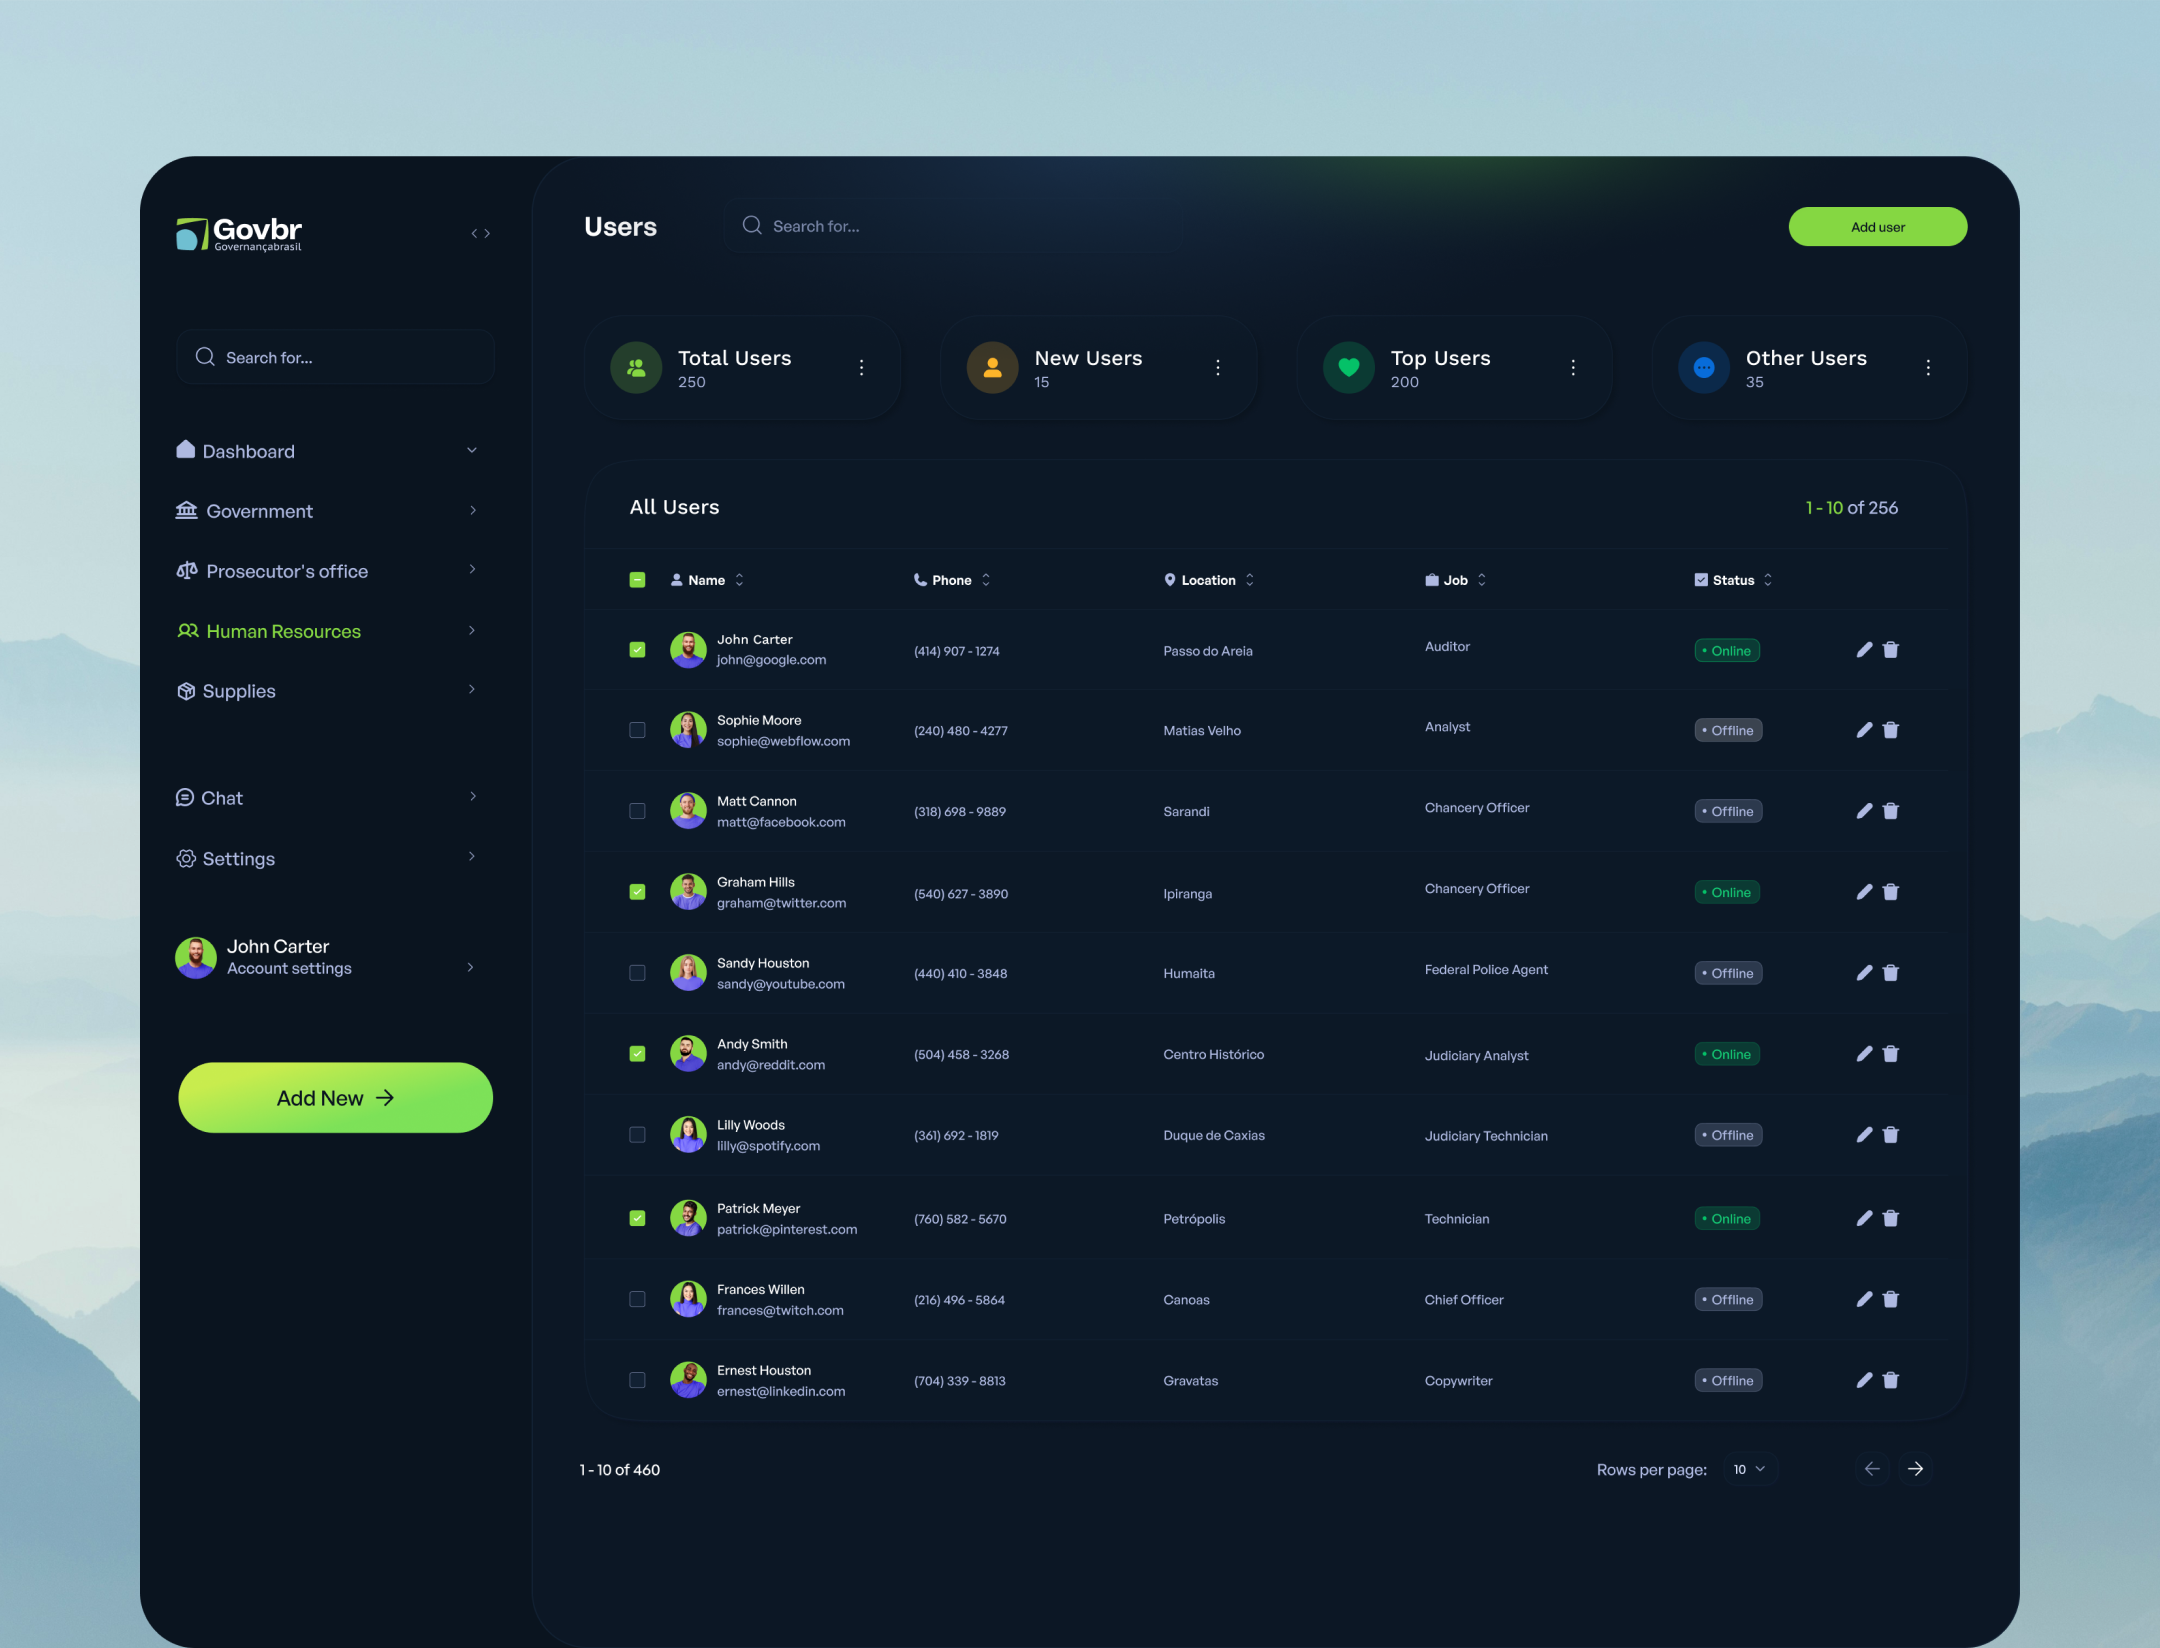
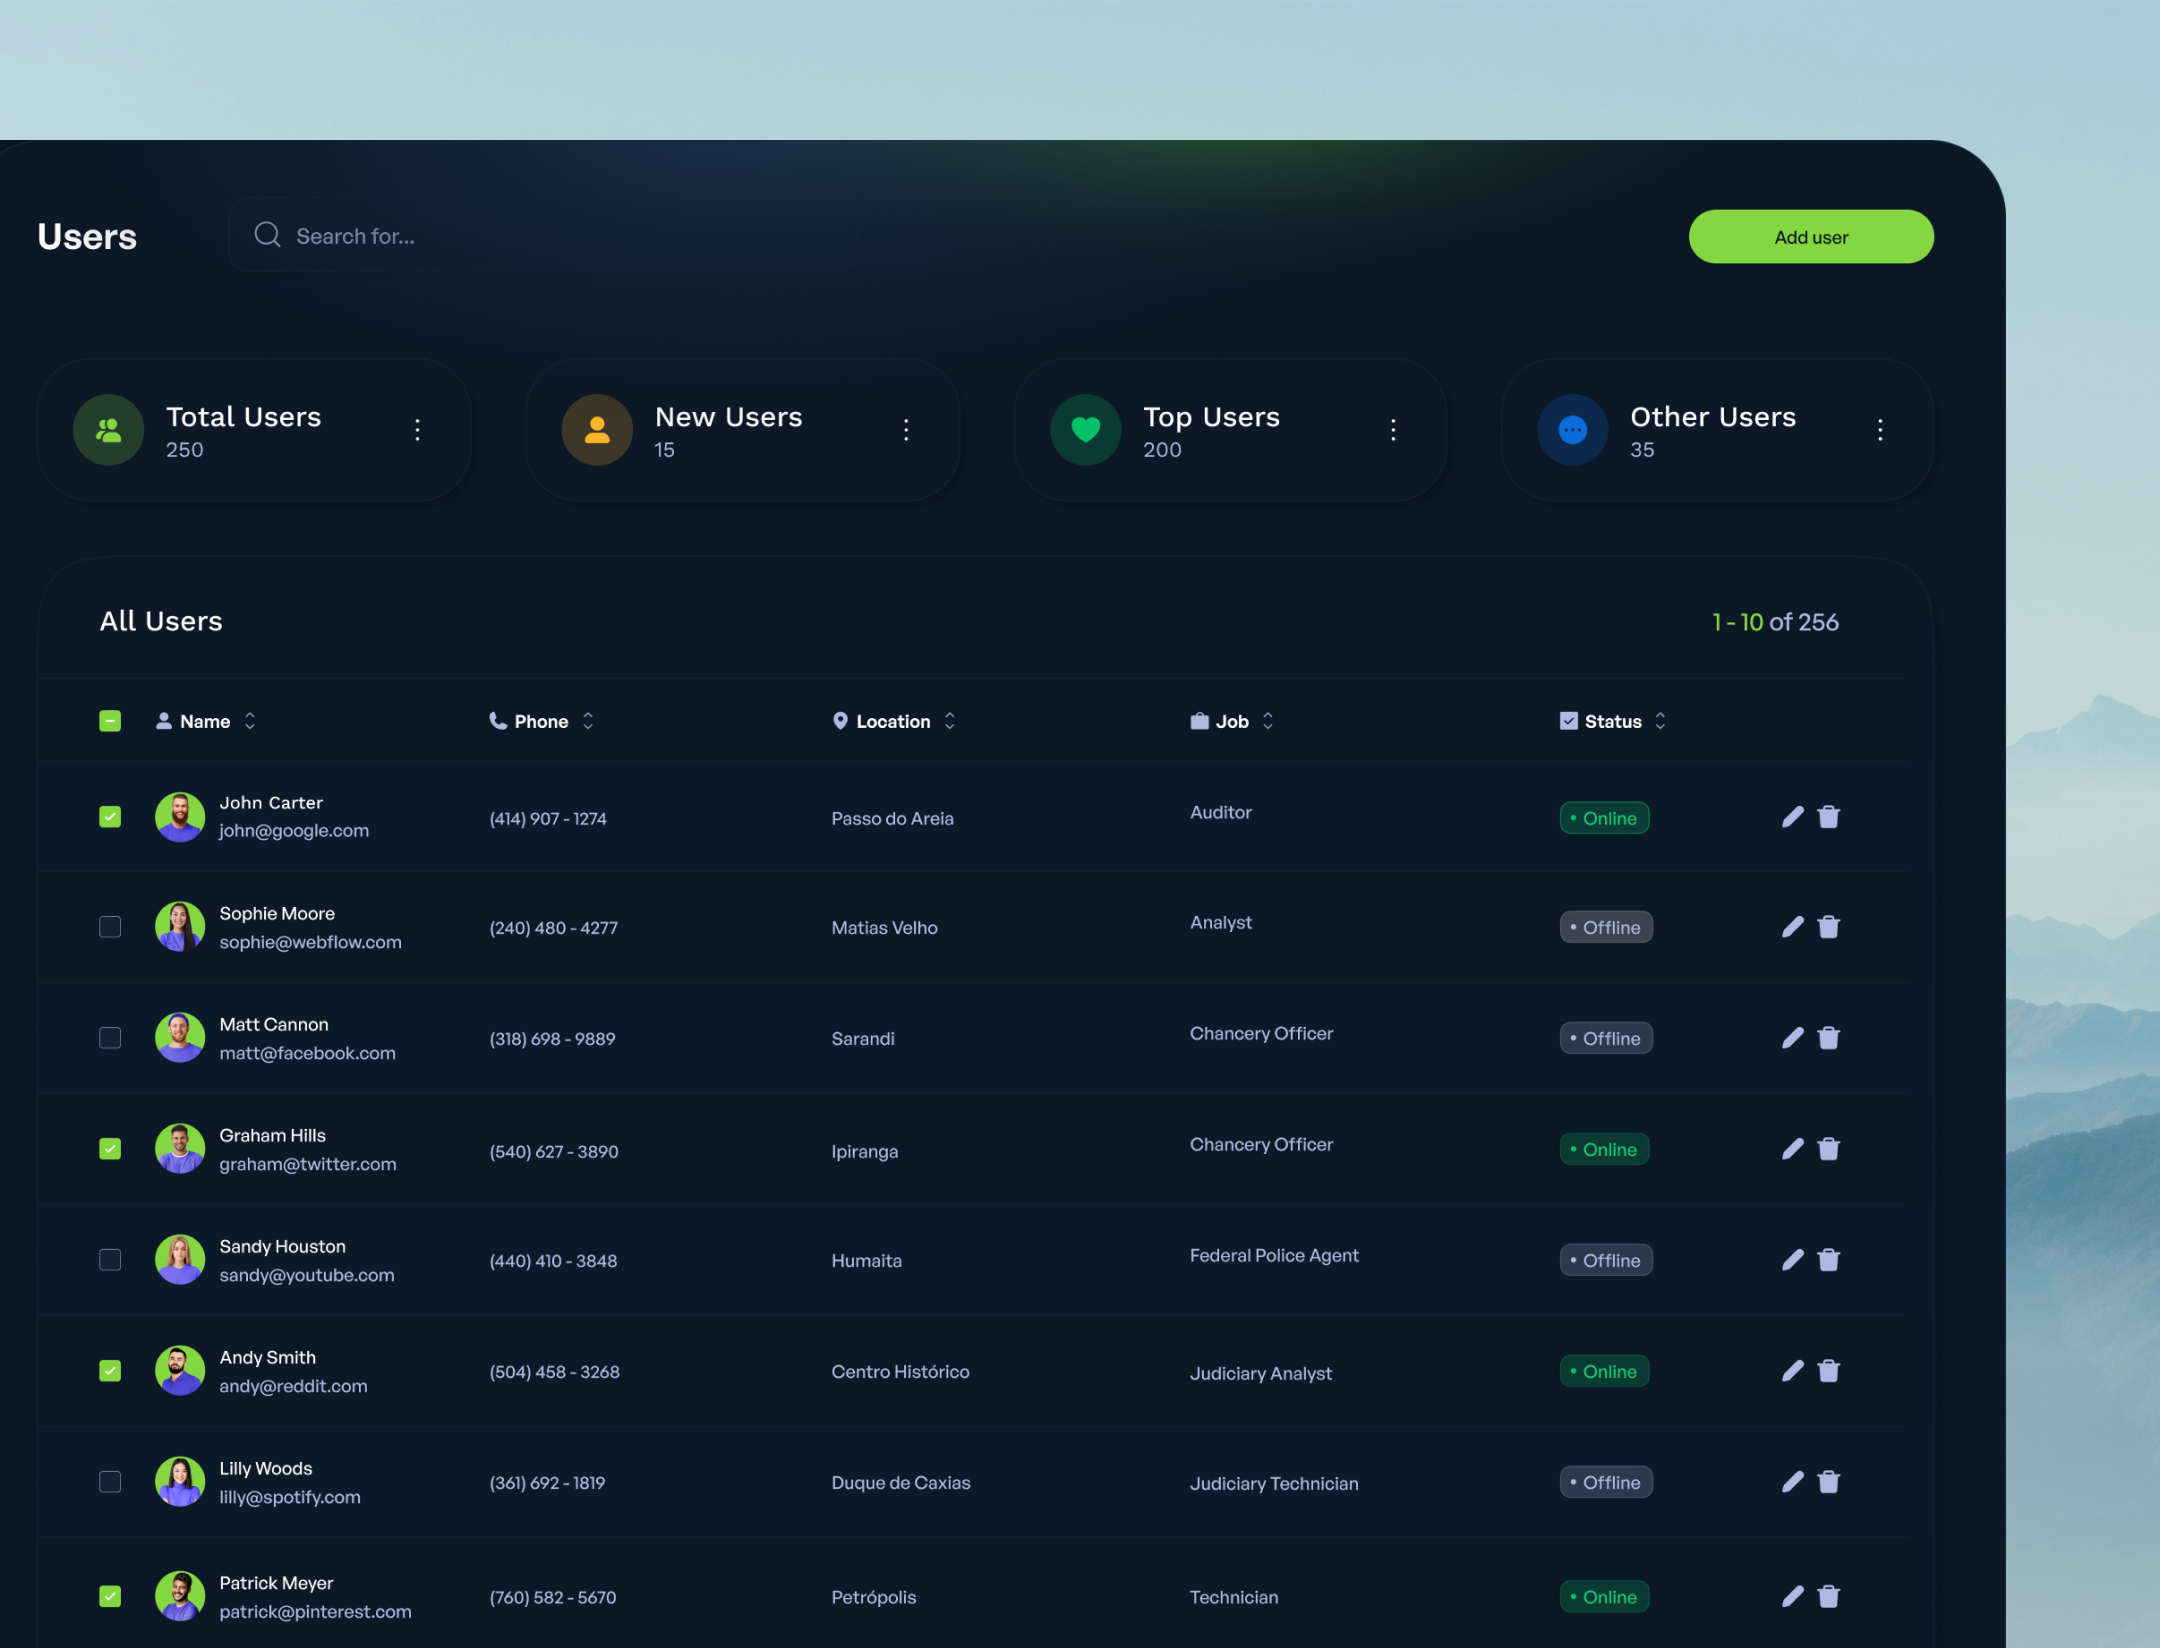
GOVBR is a management system used by Brazilian municipalities for payroll, tax collection, legal petitions, protocol tracking, and compliance workflows. When we inherited it, the system had accumulated roughly 35 years of feature additions without much architectural coherence. Menus were deeply nested. Workflows terminated without explanation. Field labels didn't map to anything in how municipal staff actually talked about their work. The operational cost was measurable: an audit showed a 23% drop in task completion rates year over year, and users were spending close to 15 hours a week just navigating the system rather than doing work in it.
We weren't brought in to redesign the interface. We were brought in because the interface problems were symptoms of deeper structural issues, workflows that didn't match how municipal teams actually operated, a data model that treated related civic processes as completely separate, and no caching strategy that could handle the load spikes during tax collection periods.
What We Actually Changed and Why
Workflow restructuring. The original system exposed every available action regardless of context. We mapped how teams actually moved through processes, who initiated what, what triggered what, what typically followed what, and used that to filter what the system presented at each step. A tax auditor mid-review doesn't need access to payroll functions. Showing those options wasn't helpful; it was noise. We limited the visible action set to the 5-7 most contextually relevant options based on role and current task state. This sounds obvious, but it required renegotiating a lot of organizational assumptions about how the software should behave.
Caching layer for read-heavy workflows. Government administrative dashboards have an unusual usage pattern: the same data gets read many times (treasury balances, litigation status, payroll summaries) and written infrequently by comparison. We introduced Redis 4.0 as a cache for the last 30 days of operational data, with background workers handling the write path to PostgreSQL. This eliminated the interface freezes users complained about during peak periods. The tradeoff is that cache invalidation now happens asynchronously, which means there's a short window where displayed values might lag behind actual state, we made that explicit in the UI rather than pretending it didn't exist.
Relational graph for cross-domain relationships. The most brittle part of the original architecture was that related civic events, a property tax decision, the corresponding legal notification, the impact on budget projections, lived in disconnected tables with no modeled relationship. Staff maintained those connections manually in spreadsheets and institutional memory. We modeled them explicitly using PostgreSQL's recursive CTEs, building an adjacency-list graph within the relational schema. When a tax decision was recorded, the system automatically linked it to the relevant budget entries, legal obligations, and audit requirements. This worked well for graphs up to about 4-5 levels of depth; beyond that, CTE traversal times became noticeable and we cached the hot paths in Redis. A true graph database would have handled deeper traversal more gracefully, but for the relationship depth we actually had in practice, PostgreSQL was sufficient and kept the operational surface simpler.
Technology Choices
We used React 16, which had just released its Fiber reconciler. The specific reason was incremental rendering, the system needed to stay responsive while processing background updates, and React 15's synchronous rendering model would block the UI during those operations. In hindsight this was a reasonable bet; in September 2017 it was newer than we'd have preferred.
PostgreSQL 9.6 for primary storage. Government transactions need strict consistency, a tax payment either processed or it didn't, and audit requirements demand a clear, non-negotiable record. Eventual consistency models are philosophically misaligned with that requirement, not just technically inconvenient. We used PgBouncer for connection pooling and read replicas for analytics queries. At 2,100 concurrent users, PostgreSQL handled the load without significant tuning.
GraphQL with Apollo Server 1.0 for the API layer. Each municipality had slightly different field configurations and permission structures. Building separate REST endpoints per municipality was going to become unmaintainable quickly. GraphQL let us define a unified schema that each client could query for exactly what it needed. This was a genuine risk, Apollo Server 1.0 in mid-2017 was not battle-tested at production scale, and we kept REST endpoints on Express.js for municipalities whose IT environments couldn't support GraphQL clients. Maintaining that dual surface had real ongoing cost we underestimated.
TypeScript throughout, which caught a meaningful number of bugs during development that would otherwise have reached code review. Jest and Enzyme for testing, with Storybook for component documentation. We reached 82% line coverage, though the more useful metric was that integration tests caught every API contract breakage before deployment.
Docker and Kubernetes 1.7 for deployment. Kubernetes was the controversial choice here, the ecosystem was still rough in 2017 and the operational learning curve was steep. We chose it because we were deploying across 100+ municipalities with wildly different infrastructure setups, some on-premise, some cloud, and we needed consistent deployment behavior regardless of underlying infrastructure. The abstraction layer was worth the overhead. We used rolling updates rather than true blue-green deployments, traffic shifted gradually to new versions rather than a hard cutover, which gave us the ability to monitor error rates during the rollout and roll back if something looked wrong.
Results
Eight months after deployment, daily active users had grown from 850 to 2,100. Average page load dropped from 4.2 seconds to 1.1 seconds. Time lost to navigation went from around 15 hours per week per user to about 3. Support tickets categorized as workflow confusion dropped from 40% of total volume to 11%.
The honest version of those numbers: user growth partly reflects forced adoption as municipalities migrated off the old system, not just voluntary enthusiasm. The support ticket reduction is real, but some of that came from better documentation and training, not just UI improvements. We're confident the architectural changes made the system substantially faster and more maintainable. Untangling exactly how much of the workflow improvement came from the software versus the change management process around it is harder.
What We'd Do Differently
The GraphQL dual-surface decision was harder to maintain than we anticipated. If we were starting today, we'd make a cleaner choice between the two rather than supporting both indefinitely.
The graph modeling in PostgreSQL worked for our depth requirements, but we didn't fully stress-test it before launch. We got lucky that the real-world graph depth stayed within the range where recursive CTEs performed acceptably. In a future version this warrants more rigorous benchmarking before committing.
Kubernetes in 2017 added real operational overhead during the first six months. The team spent more time debugging cluster behavior than debugging the application. For a smaller municipality count, a simpler deployment strategy would have been the better call.